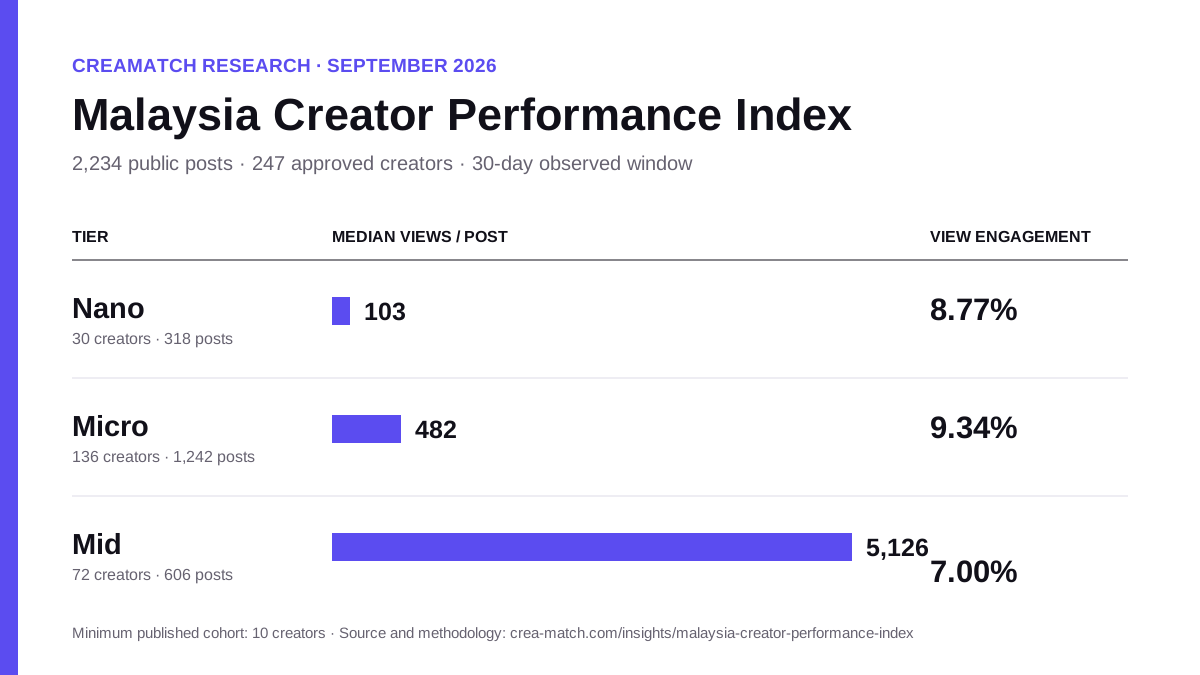
Nano
1K–10K followers103median views
8.77%view engagement
30 creators · 318 posts
Malaysia · 30-day edition · September 2026
An anonymised benchmark of 2,234 public posts from 247 approved Malaysian creators—not a survey, rate-card claim, or one viral example.
Finding 1
Their 9.34% view engagement led Nano and Mid creators in this sample. Mid creators, meanwhile, delivered a substantially higher median view count. The trade-off is why a shortlist should consider both attention quality and expected reach.
30 creators · 318 posts
136 creators · 1,242 posts
72 creators · 606 posts
Finding 2
TikTok accounts for 2,045 of 2,234 measured posts. Instagram meets the privacy threshold, but its smaller sample should be read as coverage information. Threads now has a substantial post sample, but no comparable public view count, so its available interaction signal is reported separately instead of being turned into a misleading percentage.
| Platform | Creators | Posts | Median views | View engagement |
|---|---|---|---|---|
| TikTok | 239 | 2,045 | 963 | 8.01% |
| 11 | 84 | 57 | 8.08% |
How to use the benchmark
For planning Compare a creator's recent median views with the relevant tier, then inspect niche and audience fit.
For buying Combine performance with deliverables, rights, reliability and the creator's actual quotation.
For reporting Record the same view-engagement formula so future campaigns remain comparable.
Methodology and privacy
View engagement = (likes + comments + shares + saves) ÷ measured views × 100
For researchers and publishers who want to cite or reuse this study.
Aggregate dataset (JSON)Download chart (SVG)Suggested citation: Creamatch, “Malaysia Creator Performance Index — September 2026”. Reuse is welcome with a visible link to this report.
Creamatch pairs recent performance signals with portfolio, niche and campaign reliability.